Net Profit [📈]:
$11678.60
| type | graph | data | ||||||||||||||||||||||||||||||
|---|---|---|---|---|---|---|---|---|---|---|---|---|---|---|---|---|---|---|---|---|---|---|---|---|---|---|---|---|---|---|---|---|
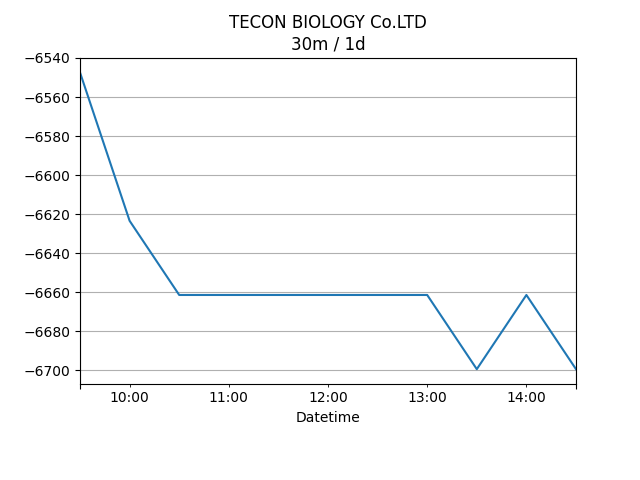
| 30m / 1d | 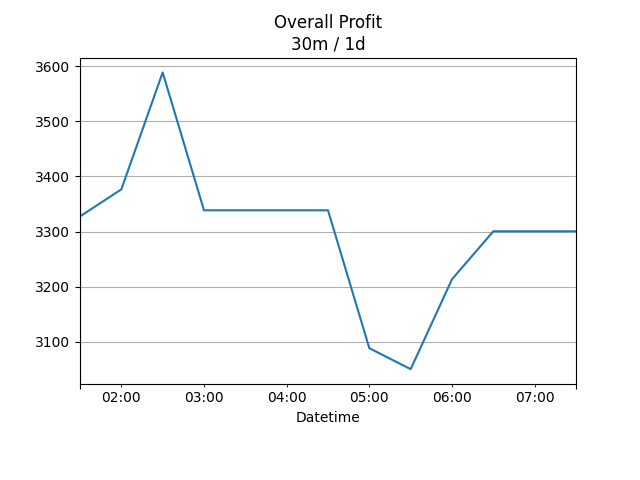 |
|
||||||||||||||||||||||||||||||
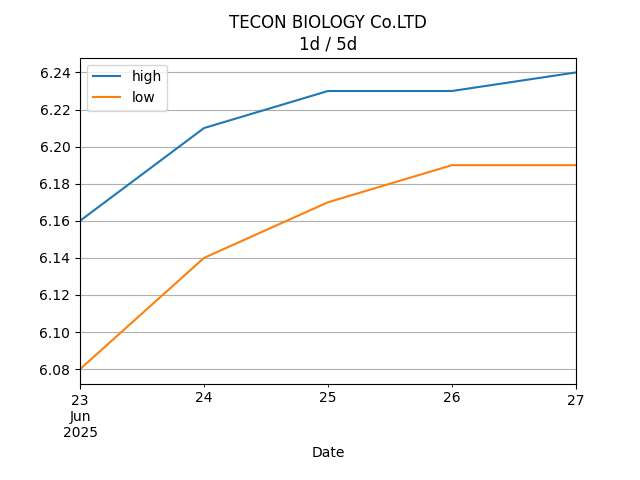
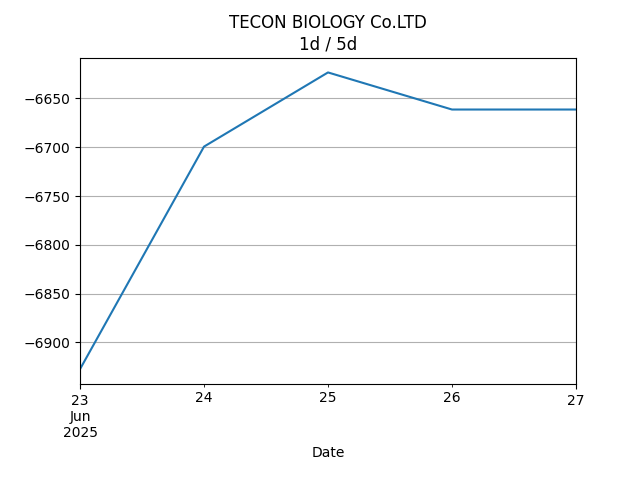
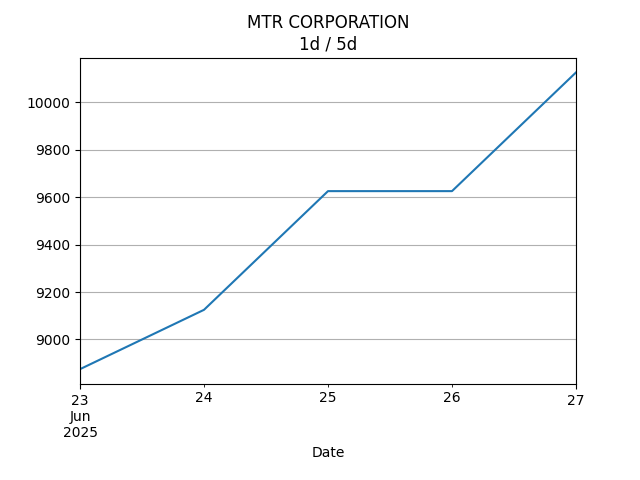
| 1d / 5d | 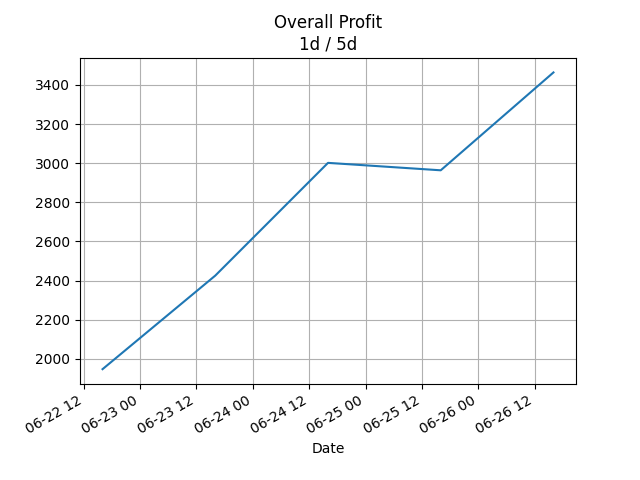 |
|
||||||||||||||||||||||||||||||
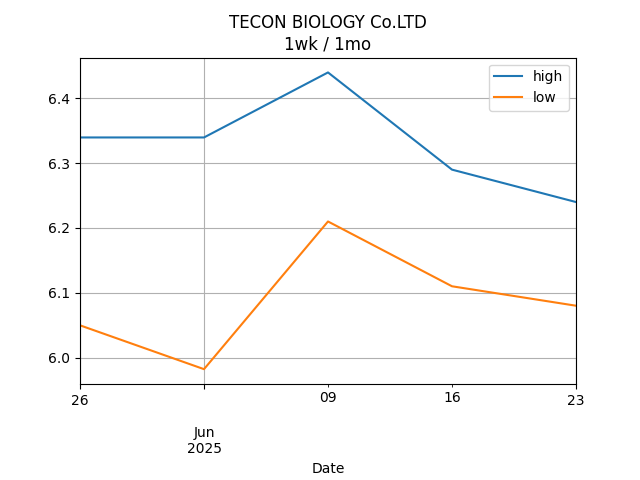
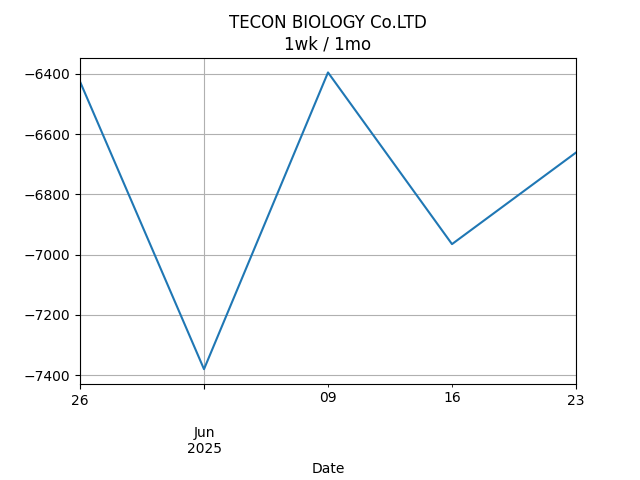
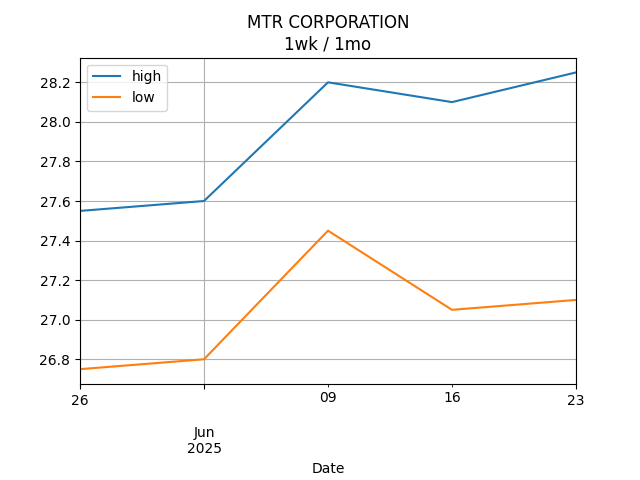
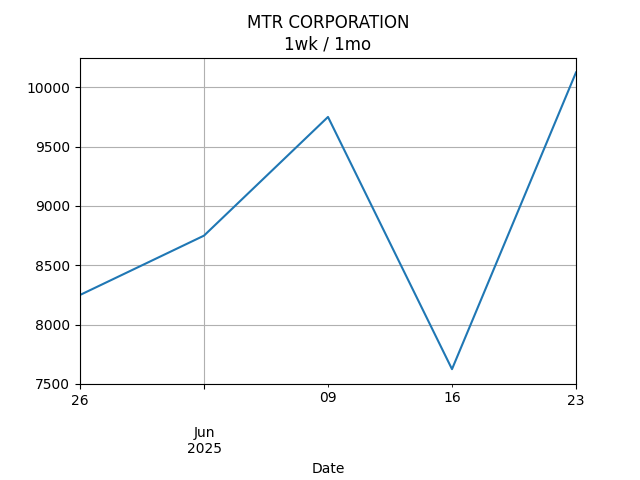
| 1wk / 1mo | 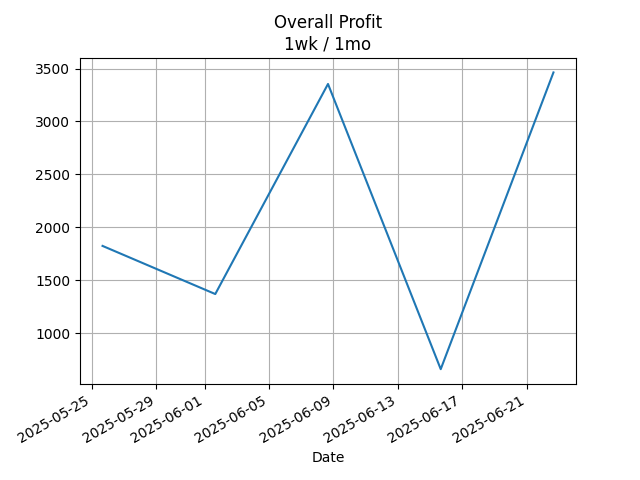 |
|
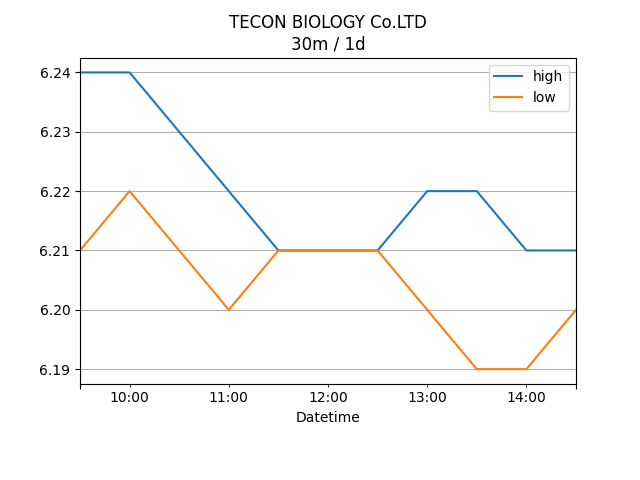
002100.SZ [📉] [$-2481.40] [-8.20%]:
TECON BIOLOGY Co.LTD
| price | profit | data | ||||||||||||||||||||||||
|---|---|---|---|---|---|---|---|---|---|---|---|---|---|---|---|---|---|---|---|---|---|---|---|---|---|---|
 |
 |
|
||||||||||||||||||||||||
 |
 |
|
||||||||||||||||||||||||
 |
 |
|
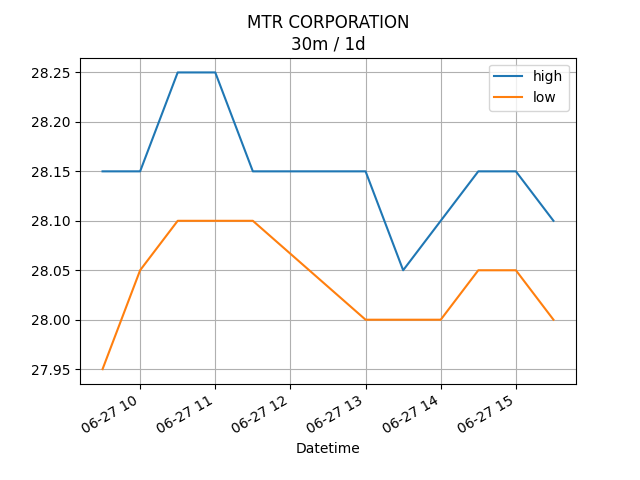
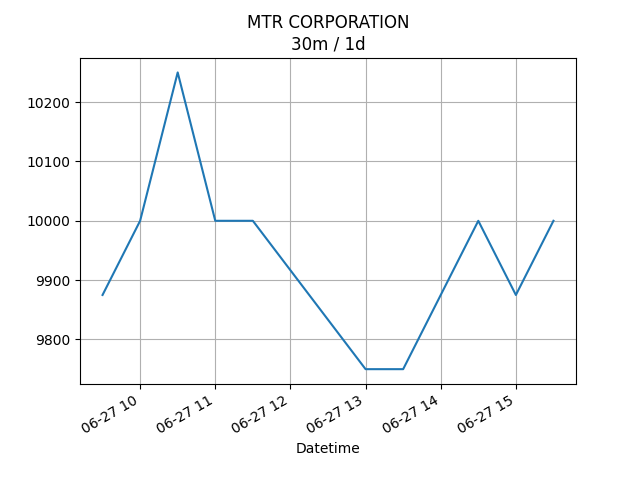
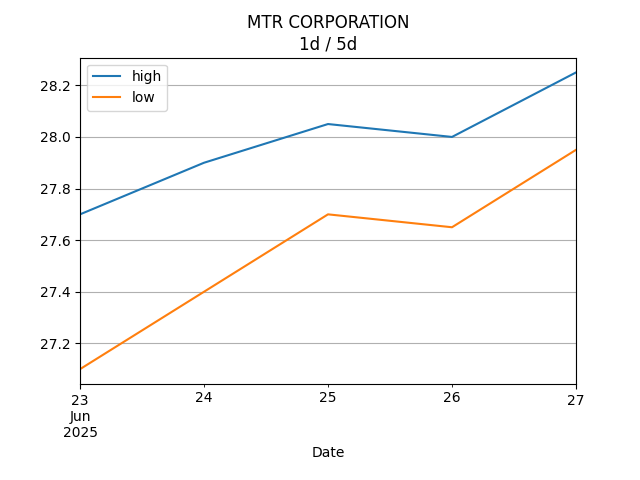
0066.HK [📈] [$14160.00] [39.17%]:
MTR Corporation Limited
| price | profit | data | ||||||||||||||||||||||||||
|---|---|---|---|---|---|---|---|---|---|---|---|---|---|---|---|---|---|---|---|---|---|---|---|---|---|---|---|---|
 |
 |
|
||||||||||||||||||||||||||
 |
 |
|
||||||||||||||||||||||||||
 |
 |
|
| type | graph | data | ||||||||||||||||||||||||||||||
|---|---|---|---|---|---|---|---|---|---|---|---|---|---|---|---|---|---|---|---|---|---|---|---|---|---|---|---|---|---|---|---|---|
| 30m / 1d | |
|
||||||||||||||||||||||||||||||
| 1d / 5d | |
|
||||||||||||||||||||||||||||||
| 1wk / 1mo | |
|
| price | profit | data | ||||||||||||||||||||||||
|---|---|---|---|---|---|---|---|---|---|---|---|---|---|---|---|---|---|---|---|---|---|---|---|---|---|---|
|
|
|
||||||||||||||||||||||||
|
|
|
||||||||||||||||||||||||
|
|
|
| price | profit | data | ||||||||||||||||||||||||||
|---|---|---|---|---|---|---|---|---|---|---|---|---|---|---|---|---|---|---|---|---|---|---|---|---|---|---|---|---|
|
|
|
||||||||||||||||||||||||||
|
|
|
||||||||||||||||||||||||||
|
|
|